UNIVERSITY OF ZIMBABWE
DEPARTMENT OF BIOLOGICAL SCIENCES
HBZ3Z02 - EXPERIMENTAL ZOOLOGY - 1995
The provisional program of Lectures (L), tutorials (T) and practicals (P) is given below. Lectures will be of 90 minutes, with an interval.
7.8 L1 Resting metabolism and scaling
7.8 T1 Equations and graphs
7.8 P1 Scaling of metabolism in fish
9.8 L2 Activity and anaerobic metabolism
9.8 T2 Ectotherms and endotherms
9.8 P2 Respirometry
14.8 L3 Evolution of endothermy
14.8 P3 Lactate production during exercise in the frog
16.8 L4 Muscle structure and function
16.8 P4 The histology and ultrastructure of muscle
21.8 L5 The contractile mechanism
21.8 T3 Introduction to muscle experiments
21.8 P5 Time course of the twitch contraction
23.8 L6 Mechanical properties of muscle
23.8 P6 Summation and tetanus
28.8 L7 Comparative muscle physiology
28.8 P7 Length and tension
30.8 L8 Locomotion and training
30.8 T4 Revision tutorial
30.8 P8 Control of smooth muscle
Objectives
The student will be familiar with gas exchange and nerve action from
HBZ213 Animal Physiology. This course examines the use of oxygen for the
release of energy in metabolism, and the conversion of energy into physical
work by muscles under nervous control. The course is thus designed to provide a
link between environmental and regulatory physiology. The experimental
programme forms an important component of the course.
Syllabus. Resting metabolism and oxygen consumption; scaling with body mass. Sources of metabolic heat in endotherms. Activity metabolism; aerobic and anaerobic. Anaerobic metabolism in anoxia. Exercise in ectotherms and endotherms; evolution of endothermy. Structure and function of vertebrate skeletal muscle; cellular organization, mechanism of contraction, and control of contraction. Mechanical properties of muscle; twitch, summation and tetanus. Structure and function of cardiac and smooth muscle. Fibre types in skeletal muscle. Control of vertebrate and arthropod muscles. Specialized muscles in insects and molluscs. Use of muscles; fibre orientation, power output, and training.
Course Assessment: Theory. Write an essay to "Critically discuss the enhanced aerobic capacity model for the evolution of endothermy". Give a specific reference for any factual statements made: a list of books consulted is inadequate.
Reading list in addition to general animal physiology textbooks such as Schmidt-Nielsen (recommended for the introductory Animal Physiology course):PRACTICAL 2
Respirometry
Metabolic rate varies with a large number of variables, the most important of which are temperature, body size, and the mode of thermoregulation of the animal. This practical investigates these factors in a variety of terrestrial animals. Oxygen consumption of air-breathing animals is measured by respirometry of various types. You will use the Barcroft respirometer to measure oxygen consumption in a locust, a small ectotherm. An oxygen analyser will be demonstrated, and you can analyse previously obtained results to obtain the oxygen consumption of ectothermic and endothermic vertebrates. Finally, a simple experiment investigates the ability of ectothermic and endothermic vertebrates to support sustained activity.
2.1 Oxygen consumption of the locust
The Barcroft respirometer is a constant pressure system which works on the following
principle. The animal is placed in a flask, connected by a U-tube containing coloured
liquid to a control flask of the same volume. The control reduces the effects of temperature
fluctuations. The animal consumes oxygen and gives off carbon dioxide, which is absorbed by a
small bag of soda lime. This causes a decrease in pressure in the flask with the animal, and
hence a change in level of the liquid in the U-tube.
To read the volume of oxygen consumed, the liquid in the U-tube is brought back to its original level by racking up mercury in a graduated pipette connected to the flask containing the animal. This restores the pressure in the animal chamber. The change in level of the mercury in the pipette gives the volume of oxygen consumed in a measured time at the temperature and barometric pressure of the experiment.
2.2 Demonstration of oxygen analyser
Ectotherms and endotherms differ in the
source of heat used in thermoregulation; external and internal (metabolic),
respectively. Metabolic heat production in endotherms gives them a large degree
of independence from the environment, but at the cost of increased energy use
in resting metabolism. This part of the practical compares the resting oxygen
consumption of an ectotherm and an endotherm of similar size. The data were
obtained using an oxygen analyser, which will be demonstrated.
The oxygen molecule has the property of paramagnetism, that is it has a magnetic permeability greater than 1 (due to unbalanced electron spins). Application of a magnetic field to oxygen tends to align the magnetic axes of the molecules with the field, increasing the magnetic flux through the gas. Oxygen is the only common gas with this property, which is exploited in the oxygen analyser. A gas sample passes through a dumbbell-shaped glass chamber, suspended on a quartz fibre, around which is a magnetic field. When the dumbbell contains oxygen the magnetic flux changes, altering the balance of the dumbbell on the fibre. The rotation of the dumbbell is measured optically or electrically.
The oxygen consumption of an animal can be measured by either an open system (that is, with gas flowing continuously past the animal) or in a closed system (in a closed chamber). The oxygen analyser available is not sufficiently sensitive to measure the depletion of oxygen by small animals in an open system, and so a closed system is used. The analyser is first calibrated with air and with nitrogen, giving 20.95% and 0% of oxygen. The output from the analyser is passed to a chart recorder, the sensitivity and paper speed of which has been previously calibrated.
The animal is placed in the chamber, an air line is connected, and the animal allowed to settle for 30 minutes. The chamber is then sealed; this is the start of the measurement. After a suitable length of time, the air from the chamber is pumped through the oxygen analyser (after passing a tube of drying agent), and the percentage of oxygen measured on the chart recorder. The flow rate of the air is measured with a flowmeter.
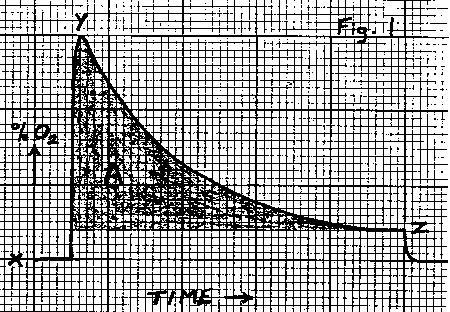
The chart recorder should give a curve of the following form (Fig. 1), where:
x = baseline, the percentage of oxygen in air (20.95%).
y = the approximate percentage of oxygen in the air in the chamber after the experiment.
z = the percentage of oxygen in air flowing past the animal in the open system
(too small to measure accurately).
If the flow of air during the settling period is similar to that used during
the measurement, then the volume of oxygen consumed is calculated using the
formula:
O = A.D.T.F/100 (equation 1)
where:
O = the volume of oxygen (ml).
A = the area (square mm) of the curve above z (the shaded area in Fig. 1).
D = the calibrated deflection on the chart recorder (% oxygen mm-1).
T = the reciprocal of paper speed of the chart recorder (min mm-1).
F = the flow rate of air (ml min-1).
A tortoise (815g) and a guinea-pig (382g) were placed in chambers at 25OC, and oxygen consumption was measured after 180 and 15 minutes, respectively. Afterwards, air was pumped through the chambers at a rate of 1.77 l min-1; a copy of the chart record from the oxygen analyser is given overleaf.
1. Measure the area under the curve (but above z) by tracing and counting squares on mm graph paper.
2. Calculate the volume of oxygen consumed using equation 1. You need to know that the chart recorder speed was 5 mm min-1, the deflection between 0% and 21% oxygen was 208 mm, and atmospheric pressure was 645mm Hg.
3. Convert the volume of oxygen consumed to a rate of oxygen consumption (ml h-1) by dividing by the time that the chamber was sealed. Calculate the mass-specific oxygen consumption (ml g-1 h-1) of both animals, corrected to S.T.P.
2.3 Endurance of frog and mouse
The high resting oxygen consumption of
endotherms is correlated with high aerobic metabolic rates during peak
activity. Endotherms can therefore achieve higher levels of sustained activity
than ectotherms. The limitation of performance in ectotherms is to some extent
overcome by the use of anaerobic metabolism, which allows high rates of ATP
production in the short term, but leads to relatively rapid exhaustion. The
final part of this practical compares the endurance of an ectotherm and an
endotherm.
Write-up
Discuss your results in terms of the metabolic capacities of ectotherms and endotherms,
and the effects of body mass and temperature.
PRACTICAL 3
Lactate production during exercise in the frog
Animals have much higher rates of oxygen consumption when active than at rest. The ratio of active to resting aerobic metabolic rate is the factorial scope. It is typically about 10 in vertebrates, both ectotherms and endotherms. Since the resting metabolic rates of endotherms are much higher than those of ectotherms, it follows that endotherms have much more energy available for activity from aerobic metabolism.
Ectotherms can overcome this limitation to some extent by using anaerobic energy production during activity. Ectotherms can thus achieve similar levels of total energy production, and thus locomotory performance, to endotherms. The disadvantage is that anaerobic end products accumulate and cause rapid exhaustion of ectotherms, as investigated in Practical 2.3.
The rate of anaerobic metabolism during activity can be measured by following the accumulation of end products. The most common anaerobic reaction during activity of vertebrates is conversion of glycogen to lactate. In this practical you will measure the level of lactate in the muscles of rested frogs, and in those exercised for a short period. The rate of lactate production, and thus of ATP formation, can then be calculated.
Stages 3-4 and 8 are done in a cold room. Some of the reagents used are dangerous. DO NOT PIPETTE BY MOUTH. AVOID SPILLAGES; INFORM A TECHNICIAN IF THEY OCCUR.
Write-upEstimate the relative contributions which aerobic and anaerobic metabolism make to ATP production over 4 minutes of maximal activity. Assume that the resting rate of oxygen consumption in the frog is 0.07 ml g-1 h-1, and the maximal rate is 0.7 ml g-1 h-1. (Note: The thigh is mostly muscle, and so will have higher lactate production per gram than the body as a whole. Assuming that muscle makes up about half of body weight, the ATP production of the whole body (in moles ATP g-1 h-1) will be half that of the thigh.) You will need to use the conversion factor 1 ml oxygen consumed = 0.290 mmol ATP.
PRACTICAL 4
The histology and ultrastructure of muscle
The physiology of muscle cannot be understood without knowledge of its structure. In this practical you will observe muscle tissue with the light miscroscope and measure and draw what you see. The ultrastructure of muscle is shown in a series of electron micrographs.1. Motor end plate (Carolina H1658, teased snake skeletal muscle stained with gold chloride). The synapse between a motor axon terminal and a skeletal muscle fibre is known as a motor end plate. The axon may branch to innervate several muscle fibres, spread through the muscle, but each fibre has only one end plate. The axon loses its myelin sheath just before the end plate, which is a branched, beaded structure giving a large area of contact for transmitter release.
Make a high power drawing of a motor end plate and the associated axon and muscle fibre. Measure the diameter of the fibre and the axon.
2. Smooth muscle (Philip Harris M10500/0, Small intestine T.S.). Smooth, involuntary or visceral muscle is found in the walls of hollow organs such as the gut and urogenital tract. In the intestine it is arranged as an outer longitudinal layer and an inner circular layer, which lie outside the absorptive surface (mucosa) of the gut. The two layers form an antagonistic system, which can pass peristaltic waves along the gut. A section of intestine thus shows smooth muscle cells in both L.S. and T.S.
Make a low power drawing of the gut section, showing the orientation of the muscle layers. Make high power drawings of small areas to show a few smooth muscle cells in both T.S. and L.S. Note the shape of fibres, position and number of nuclei, and presence of fibrils or striations. Measure the length and diameter of a few cells. These may also be seen in the section of isolated smooth muscle (Carolina H1260, stained with haematoxylin / eosin).
3. Ultrastructure of smooth muscle (EM 20.1, Smooth muscle from the oesophagus of a bat (Myotis). Magnification x 35 300). Smooth muscle is not striated because the filaments are not arranged in regular fibrils, as shown in this electron micrograph, which should be observed carefully but not drawn. N = nucleus; M = mitochondrion; F1 = filaments; white arrows = concentrations of cytoplasmic material on either side of cell membranes, regions of specialized contact; Pt = invaginations of cell membrane; NF = terminal part of small autonomic nerve fibre containing M' = mitochondrion and V = synaptic vesicles.
4. Skeletal muscle (Turtox H3.11, Turtox H7.11). Striated or voluntary muscle forms the skeletal muscles used in locomotion. The filaments are arranged in regular patterns, giving the muscle cells (fibres) a striated appearance. Skeletal muscle fibres are multinucleate syncytial cells, formed by the fusion of many myoblasts during development.
Make high power drawings of portions of the muscle fibres showing their major features, including the cellular organization, the number and position of nuclei, and the presence of striations. Measure the length and diameter of the fibres. Also observe the section stained with haematoxylin / eosin (Carolina H1310).
5. Ultrastructure of skeletal muscle (EM 20.2, Skeletal muscle from the tail of a tadpole of Rana pipiens. Magnification x 26 700). The striations visible with the light microscope are seen with the electron microscope to be due to a regular arrangement of the filamants into fibrils. This EM shows a small part of one muscle fibre. Key to symbols. * = individual fibrils, separated and surrounded by sarcoplasm. Z = Z line; I = isotropic band (the light band under light microscope); A = anisotropic band (dark band under LM); H = H band; SR = sarcoplasmic reticulum, forming large sacs near the Z lines (SR'); TS = T system. Note the thick and thin filaments.
Draw the whole electron micrograph, giving a scale bar, and label the main features. Measure the diameter of the myofibrils and the length of the sarcomeres. What state of contraction is the muscle in ?
6. Cardiac muscle (Turtox H3.310). Vertebrate cardiac muscle is also striated, having a similar organization of filaments to skeletal muscle. The major structural difference is the cellular organization, with mononuclear cells joined at the ends and at lateral branches by electrical synapses. These serve to spread a wave of contraction rapidly through the heart, allowing it to function as an effective pump.
Draw a few cells under high power, showing the arrangement of intercalated disks, lateral branches, and nuclei. Measure the length and diameter of the cells. Also observe the section stained with haematoxylin / eosin (Carolina H1350).
7. Ultrastructure of cardiac muscle (EM 20.3, Cardiac muscle from the heart of a bat (Myotis). Magnification x 28 200). This EM shows parts of several fibres, those at the upper right being separated from the column of cells on the left by a thin layer of collagen fibrils (Co) surrounding a capillary lined by an endothelial cell (E). Several fibrils can be seen in each fibre, separated by large mitochondria (M). Z, I, A and H are as in skeletal muscle. L = lipid droplets; a,b,c = intercalated disks; d = tight-junctions between fibres at points other than intercalated disks; * = invagination of sarcolemma at Z line, in position of T system of skeletal muscle.
Draw the whole electron micrograph, giving a scale bar, showing the cell membranes and their specialized regions. What state of contraction is the muscle in ?
Introduction to muscle experiments
This part of the practical course has been designed to serve as an introduction to electrophysiological experimentation and to illustrate some of the fundamental properties of muscle tissue. Practicals 5-7 use the same combination of electrical stimulation of the frog gastrocnemius preparation, recording the results on a kymograph. Aspects common to all three practicals are considered here.
Electrical stimulation
A great deal of electrophysiological investigation is
based on the fact that excitable tissues, nerve or muscle, can be stimulated
artificially by electricity. Depolarizations similar to those which
characterize active nerve or muscle can be induced by passing a current pulse
across the excitable membrane. Such induced depolarizations will be propagated
along the nerve or across the surface of the muscle fibre and produce entirely
normal effects at their site of action. In this way some of the fundamental
properties of neuromuscular systems can be investigated.
Suitable current pulses can be produced with electronic stimulators; these provide a regular square-wave stimulus whose parameters (duration and intensity) can be accurately controlled. Please note that electronic equipment should not be constantly switched on and off; switch on at the beginning of the practical, and leave on until you have completely finished.
The frog gastrocnemius preparation
The frog gastrocnemius is a particularly
useful preparation for the study of muscle contraction because it is of
reasonable size, is relatively robust, can be isolated from the blood
circulation without serious deterioration, can be stimulated directly or
through the sciatic nerve, and comes from an ectotherm and so can tolerate wide
variations in temperature. Before starting, you should note the following
points:
a) Considerable care must be taken with the dissection because the tissue must be able to function after you have finished preparing it. The experimental material will be alive and as such entitled to respectful treatment. Always ensure that the experimental animal is dead before you dispose of it.
b) Never over-stimulate a preparation, switch off as soon as you have obtained the required record, and allow a reasonable rest period for recovery between stimulation. Note that the deterioration of the preparation is usually irreversible, and it pays to look after it carefully from the beginning.
c) It is most important that the tissues are not allowed to dry. Therefore, once you have removed the skin from the frog, you must moisten the preparation frequently with Ringer's solution. Isolated nerves and muscles should be handled gently.
Using the kymograph
The kymograph is a recording device used to measure
events which result in movement. The basic features include a motor with clutch
and gears, and a drum which rotates giving a writing surface which moves at
constant speed. Speed can be selected using the gear position, with finer
control using the F (fast) - S (slow) lever. The smoked recording surface is
easily marked, so be careful how you handle it. Pay attention to the following
notes:
a) Arrange the equipment in such a way that you have convenient access to the stimulator, the kymograph clutch and gear selector, and to the preparation. The writing position should face the operator.
b) Place the lever to the right of the drum so that the paper moves away from the point, not towards it. The lever should be at 90O to the paper at the point of contact, so that it moves over the paper with minimum friction throughout its movement. Otherwise, the lever will leave the paper at the peak of the movement.
c) Release the lever at the top to change the height of the drum, or fit a new drum. The lever may need tightening with a screwdriver when a new drum is fitted. Start with the drum at its highest position, with the lever point about 2 cm up the paper. Move the drum down for subsequent records.
d) Before you start to record make sure that the preparation is working; only place the lever on the smoked drum after you have tested the result. Adjust the lever magnification factor in such a way that lever excursion is kept within limits of about 2-4 cm.
e) Make a baseline trace before any recording, by rotating the drum by hand through 360 degrees, with the CLUTCH DISENGAGED. Use the clutch, not the switch, for starting and stopping the drum.
f) Immediately you have made a recording, you must write on the drum the details of what each part of the recording is; include as much information as possible.
g) Calibrate drum speed at each setting of the kymograph. Do not trust the settings of different kymographs, even if the same model.
h) Move levers and other equipment well away from the kymograph before you remove the paper for varnishing. Pass the paper through the trough of varnish smoked-side up.
i) When the paper is dry, cut out the required sections and stick into your write-up, with labels. Information on the settings (point f) should thus be near the record. Do not just attach the whole record.
Recording levers
Two recording lever positions are commonly used:
a) ISOTONIC (constant tension); the muscle is allowed to change length during contraction, but at a constant tension. This is shown diagrammatically in Fig. 2b, and in detail in Fig. 2a. The muscle contracts and moves the recording lever about a free pivot. Tension on the muscle is kept constant at a suitable level by attaching a small weight (for example, a piece of plasticene) to the lever.
b) ISOMETRIC (constant length); the muscle length is almost fixed, and tension increases during contraction. This is shown diagrammatically in Fig. 2c. Contraction of the muscle is opposed by the fixed pivot acting as a strong spring. Movements of the recording lever are proportional to the tension in the muscle. The tension is calibrated by substituting weights in the position of the muscle, and noting the resulting deflection of the lever.
In either case, the lever should be horizontal in the neutral position (before contraction) to minimise distortion of the kymograph record.
PRACTICAL 5
Time course of the twitch contraction
The speed with which a muscle can contract and relax is important since it will determine the frequency with which a given movement can be made. This is particularly relevant in the case of the rhythmic actions on which the locomotion of most animals depends. Such actions are generally based on the alternate contractions of pairs of antagonistic muscles (e.g. flexors and extensors), and for efficiency it would be important to ensure that one member of a pair has relaxed fully before its antagonist starts to contract. Otherwise, much of the force of the contraction would be wasted on stretching the antagonist.
The case of aquatic ectotherms is of special interest in this connection. Seasonal and diurnal fluctuations of temperature might have important effects on their locomotion if they affect the rate at which muscles contract and relax. In this practical you will investigate the time course of the twitch contraction of the aquatic frog Xenopus at three temperatures.
Write-up
Calculate the Q10 of twitch parameters over the range 10OC to room
temperature, and room temperature to 30OC, and discuss the significance of the
result. Hint: If the limiting reaction in the development of tension and in
relaxation was chemical (e.g. ATPase activity) the Q10 would be expected to be
greater than 2; if it was physical (e.g. diffusion) Q10s would be much lower,
in the range 1.0-1.5.
Estimate whether the speed of the muscle twitch limits swimming in frogs at any of the three temperatures. The results in Table 1 are for Xenopus of mean body length 65mm, from a practical in a previous year.
Table 1. Swimming performance of Xenopus at different body temperatures (means and S.E. of ten measurements).
o C | Swimming speed (cm s-1) | Stroke frequency (s-1) | Stroke length (cm) |
| 10 | 26.5 +2.9 | 1.29 +0.07 | 20.5 +1.6 |
| 15 | 41.4 +3.7 | 1.24 +0.10 | 34.0 +2.5 |
| 20 | 47.6 +2.0 | 1.22 +0.04 | 39.0 +1.7 |
| 25 | 50.2 +5.3 | 1.58 +0.15 | 32.1 +1.8 |
| 30 | 63.0 +7.2 | 1.77 +0.14 | 36.9 +4.1 |
Reference
John-Alder, H. B., Barnhart, M. C. and Bennett, A. F. (1989).
Thermal sensitivity of swimming performance and muscle contraction in northern
and southern populations of tree frogs (Hyla crucifer). J. exp. Biol. 142,
357-372.
PRACTICAL 6
Summation and tetanus
The curvilinear relation between muscle length and resting tension (which you will demonstrate in the next practical) suggests the existence of an elastic component to the muscle. This implies that a part of the tension developed during a muscle twitch would be taken up in stretching the elastic component. If a second contraction is induced at a time when the elastic component has been fully stretched by the first contraction, then the total tension should exceed that during the first contraction. This is the phenomenon of "summation".
Summation is investigated experimentally by using two stimuli, which are gradually brought closer together until full summation occurs. From the results of this experiment, you can estimate the time interval between successive stimuli which would be required to produce a smooth fusion of tension, rather than a series of identifiable twitches. Clearly if a series of stimuli are then delivered at the corresponding frequency, a sustained contraction should result. This is the muscle tetanus, and is in fact the normal in vivo mode of activation of skeletal muscle. You will demonstrate muscle tetanus, and compare the tension developed with that of the twitch contraction.
Write-up
Present kymograph records of summation, and estimate the frequency
required for tetanus. Present records of clonus and tetanus; does the
development of smooth tetanus occur at a frequency corresponding with your
estimate ? If not, is the discrepancy explained by fatigue of the twitch?
Present records of the single twitch of the muscle when fresh and fatigued, and
calculate the contraction and relaxation times (as in Practical 5). Calculate
the tetanus/twitch ratio which provides a measure of the degree to which
summation is effective in producing an increase in tension.
PRACTICAL 7
Length and tension
The unit of contraction in skeletal muscle is the twitch, which may be summed to a smooth tetanus, as seen in the previous practicals. In view of the structure of the muscle fibres, and of the fact that tension develops as a result of the interaction between the actin and myosin filaments, it is clear that the amount of tension developed in a single twitch should depend on the amount of overlap between the actin and myosin filaments. This should in turn depend on the extent to which the muscle is stretched.
It should be possible to investigate the situation very simply, by determining the relation between stretch, measured as the tension of the resting muscle or as its length, and the amount of tension developed over the resting tension on stimulation by a single shock, ensuring that stimulation is adequate for maximum activation of the muscle. This practical thus uses an isometric lever, where the length of the muscle is constant during contraction (but may be varied by the experimenter), and the tension is measured.
Write-up
Present kymograph records of the lever excursion produced at different
muscle lengths, and of the calibration of lever excurion to weight. Plot a
graph of the relation between weight and lever excursion. Fit a line to the
graph and use this to calculate tensions in the muscle (in g).
Make a table showing your results for the resting and active tension of the muscle at different lengths. Plot graphs of the relation between a) resting and b) active tension with muscle length. Sketch what you would imagine to be the disposition of actin and myosin filaments at stated points of curve b.
PRACTICAL 8
Control of smooth muscle
Smooth muscle is so called because it lacks visible striations. Visceral smooth muscle, with which this experiment is concerned, has certain resemblances to cardiac muscle: it is myogenic (no nervous input is required for contraction to occur) and there are low resistance junctions between cells so that excitation passes easily from one cell to the next, and contraction of adjacent cells can be coordinated.
Visceral smooth muscle is found in the walls of the gut, uterus and ureter. In the gut muscular activity is modulated (but not initiated) by nervous input from the autonomic system. Mechanical stimuli, such as stretch, and hormones also have an effect. The parasympathetic division of the autonomic nervous system, which liberates acetylcholine at the synapses, causes muscle contraction; the sympathetic division, liberating adrenaline or noradrenaline, gives rise to relaxation. It is possible to mimic the action of these nerves by application of the appropriate neurotransmitters to the isolated tissue.
Smooth muscle differs from striated muscles in its delicacy; to get reasonable results smooth muscle preparations must be treated with the greatest care. Handle as little as possible and avoid unnecessary contact with metallic instruments; clean fingers are by far the best instruments to use.
Write-up
Give an account, illustrated by kymograph records, of the spontaneous
activity of the gut and the effects of acetylcholine, adrenaline and atropine.
Describe the effects of the drugs in terms of the frequency and amplitude of
contractions, and the tone of the muscle (that is, its resting length). Discuss
your results in relation to control of gut motility in the intact animal.